
ダイエットをしているのでそれの記録管理をします
>>> 2017/9/8 <<< pakuさんからの要望より、他のソースコードも掲載しました。
グラフはChartツールを使って描きます。
今回は体重・体脂肪・BMI・骨格筋全てと体脂肪と骨格筋だけの場合との2つを切り替えて見られるようにしました。
また検索機関も1ヶ月単位あるいはすべての期間で選べるようにしました。
これでダイエットを続ける励みになればいいんだけど・・・
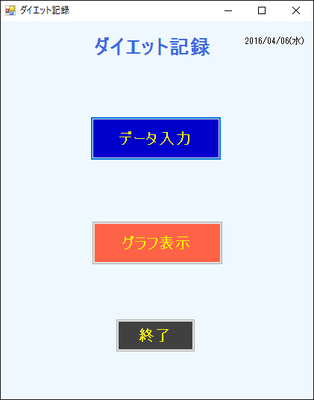
メニュー画面(Form1)の仕様
メニューを切り替えます。
|
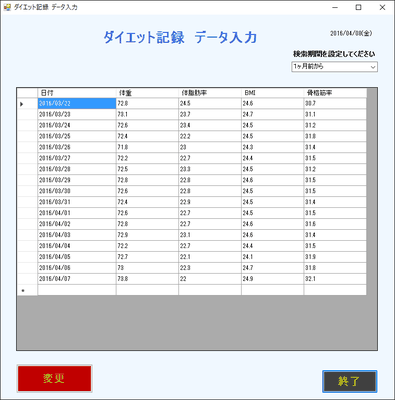
データ入力画面(Form2)の仕様
DataGridViewにデータを表示し、追加変更をします。
|
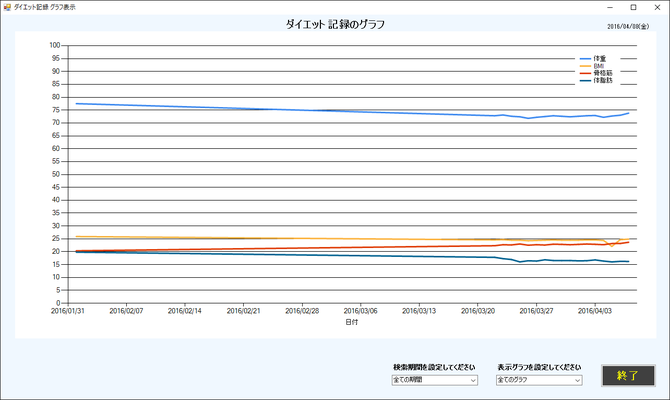
グラフ表示画面(Form3)の仕様
日付表示はラベルにしておいてプログラムで今日の日付を編集する。
グラフ領域はチャートを使用し線グラフで表示する。
検索期間はコンボボックスにして「1か月前から」「2か月前から」「3か月前から」「すべての期間」から選択できるようにする。初期値は「すべての期間」としこの値が変更された場合にはその期間に合わせたグラフを再表示する。
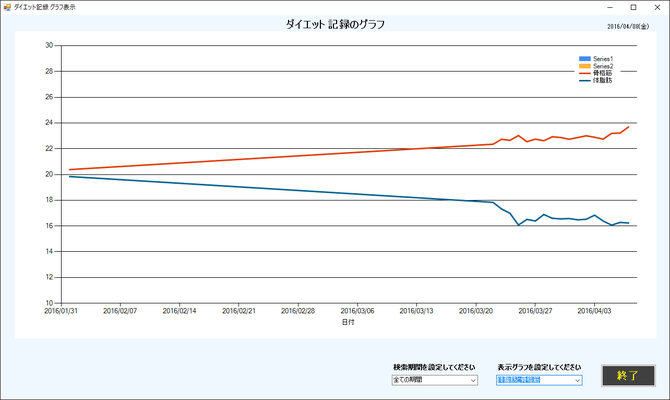
グラフの系列はコンボボックスで全てまたは体脂肪と骨格筋の2種類から選択できるようにする。初期値は「すべてのグラフ」としこの値が変更された場合にはその種類に合わせたグラフを再表示する。
体脂肪と骨格筋はそれぞれ体脂肪率×体重と骨格筋率×体重で計算する。
グラフのY軸の範囲はすべての系列の場合最大値が100,最小値が0とし、体脂肪と骨格筋だけの場合は最大値が30,最小値が10とする。
|
コメントをお書きください
paku (水曜日, 06 9月 2017 13:44)
こんにちわ.
こんにちわ。
私、現在C#の勉強をしているpakuと申します。
今回、グラフと表を使ったC#を書きたいと思い、検索していたところ
こちらのサイトに着きました。
もし、よろしければで良いのですがこのプログラムのその他のフォームのコードも
見せていただけないでしょうか?
サンプルコードを探しても、良いものが見つからなくて・・・。
よろしくお願いいたします。